
Debug
GemElement is a standard custom element that can be inspected and debugged in the browser DevTools. You can also install the Gem DevTools extension, which allows you to more intuitively inspect and modify the data of Gem elements.
Use Gem DevTools
After installation, open the Gem sidebar pane in the browser DevTools Elements panel.
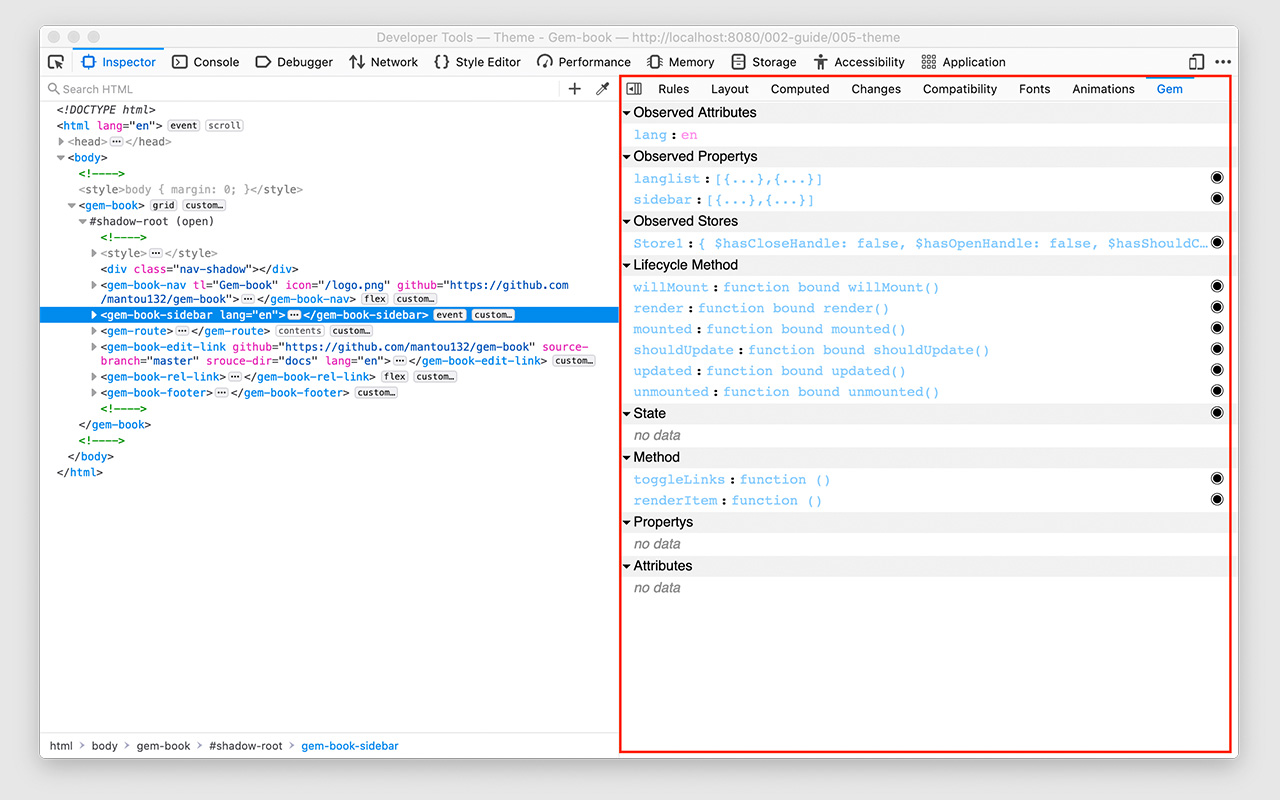
Inspect elements
Select a Gem element in the Elements panel, and the pane groups its members:
- Observed attributes, properties and stores, adopted styles, and element state
- Emitters, slots, CSS states, parts, and methods
- Unobserved attributes and properties, and static class members
Values of simple types (strings, numbers, booleans) can be edited directly; click Inspect to locate a DOM value in the Elements panel or print an object in the Console.
When a non-Gem element is selected, the pane shows statistics of all elements, custom elements, and Gem elements on the page.
If the page contains <iframe>s, use the select box at the top of the pane to switch the inspected frame.
Scan renders
When the page uses Gem, the pane header shows a Scan button. After clicking it, every element render on the page is highlighted with a box and a render count (such as x3), which fades out after about one second.
Scan makes unnecessary renders visible, for example, many elements updating because a Store they connect to is updated too broadly; see